

Dollar at Crossroad
* The dollar fell modestly against other major currencies but pared losses as US stocks turned lower in afternoon trading Thursday. The yen continued its steep decline against the greenback and other key currencies amid growing concerns over the deteriorating Japanese economy. Bank of Japan board member Tadao Noda said the economy is performing worse than what was expected just a few weeks ago. US and European economic data boosted concerns about the deepening global recession. US initial jobless claims rose to the highest level since October 1982, durable goods orders dropped more than expected and new home sales fell to a record-low rate. Meanwhile, European business and consumer confidence plunged. The euro rose despite a record fall in eurozone economic sentiment, but pared gains as US stocks declined in afternoon trading. Sterling rose on the UK government decision to insure toxic assets held by UK banks. The Canadian dollar advanced on rising crude oil but pared gains on increased risk aversion..
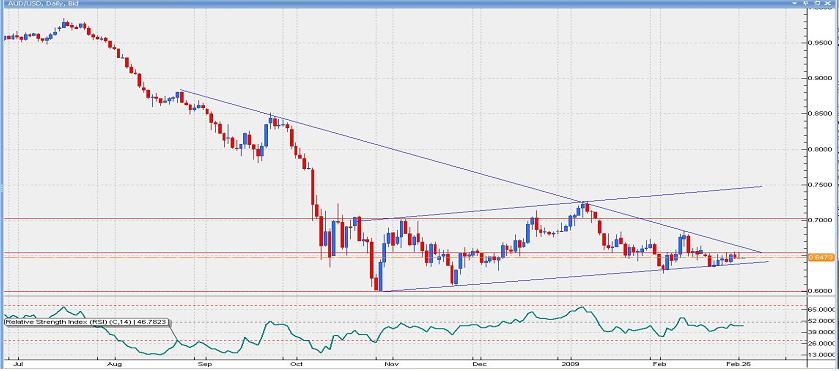
* The AUD/USD initially gained on an unexpected rise in Australia's Q4 2008 capital expenditure, reducing speculation that the Reserve Bank of Australia will cut interest rates aggressively. The gains later faded as US stocks fell. Having risen modestly since making a low on October 28, the AUD/USD is near the support from the lower trading band in the positively sloping trading channel. If this support is broken, the pair will decline. The AUD/USD is also close to the resistance from the downtrend that started last summer; if this is broken, a rally will likely occur.
Financial and Economic News and Comments
US & Canada
* Most dollar crosses are at important technical levels. This can be summed up in the dollar index chart, which is near important resistance. If the resistance in the 88-89 area is broken, the dollar will rally significantly. However, if the resistance holds and the steep uptrend is broken, the dollar will possibly fall significantly.
Dollar Index
* US durable goods orders fell a more-than-expected 5.2% m/m in January to a seasonally adjusted $163.80 billion, following a downwardly revised 4.6% m/m decline in December, according to the Commerce Department. Excluding transportation, durable goods orders declined a more-than-estimated 2.5% m/m. Durable goods orders dropped 26.4% y/y and dropped 20.5% y/y excluding transportation. A key barometer of business equipment spending, orders for non-defense capital goods excluding aircraft, declined 5.4% m/m in January, after a 5.8% m/m decrease in December. Orders dropped 20.2% y/y. Shipments for non-defense capital goods excluding aircraft decreased 6.6% m/m in January, after being flat in December; the shipments are used in calculating GDP. The government will release its second estimate of Q4 2008 GDP on Friday. It is likely that the government will sharply lower its GDP estimate to a 5.4% contraction from a previously estimated 3.8% contraction.
Durable Goods
* US initial jobless claims in the week ending February 21 unexpectedly rose 36,000 to 667,000, the highest since October 1982, from the prior week’s upwardly revised 631,000, the Labor Department said. The 4-week moving average of new jobless claims rose 19,000 to 639,000, the highest since October 1982, from 620,000. Continuing claims in the week ending February 14 cracked the five million mark for the first time, jumping 114,000 to 5.112 million, the highest level recorded since 1967, following the preceding week’s upwardly revised 4.998 million. The insured unemployment rate rose to 3.8%, the highest since July 1983, from 3.7%.
* US new home sales fell a more-than-expected 10.2% m/m to a seasonally adjusted annual rate of 309,000 in January, following December’s revised 9.5% m/m decline to an annual rate of 344,000, data from the Commerce Department showed. January new home sales dropped 48.2% y/y. The median price of a new home fell 13.5% y/y to $201,100 in January. The average price dropped 17.6% y/y to $234,600. There were an estimated 342,000 homes for sale at the end of January, below the 353,000 for sale at the end of December. However, a key measure of inventory rose in January due to falling demand. The ratio of houses for sale to houses sold rose to 13.3 from December’s 12.2. New-home sales in January fell 28.0% m/m in the West, 6.5% m/m in the South, and 5.6% m/m in the Midwest, while Northeast sales rose 12.5% m/m.
New Home Sales
Europe
* The eurozone business climate indicator declined more than expected to -3.51 in February, the lowest level since records began in January 1985, from January’s revised -3.03, data from the European Commission showed. Eurozone economic sentiment deteriorated further in February amid an intensifying recession, with the eurozone economic confidence indicator falling to 65.4, the lowest recorded since January 1985, from January’s revised 67.2. The weakness was widespread in February; consumer confidence declined to -33 from -31, industrial confidence fell to -36 from -33, and services confidence dropped to -23 from -22.
* German consumer confidence unexpectedly improved for a sixth month, with GfK AG’s consumer confidence index for March increasing to 2.6, from February’s upwardly revised 2.3, GfK AG reported.
* German unemployment rose for a fourth straight month in February, increasing a seasonally adjusted 40,000 to 3.31 million, after an upwardly revised 59,000 rise in January, the Federal Labor Agency said. The February increase was less than expected. The seasonally adjusted unemployment rate rose to 7.9%, as forecast, from January’s 7.8%.
* UK house prices dropped 17.6% y/y to £147,746 ($211,000) in February, the largest decline since records began in 1991, following a 16.6% y/y fall in January, Nationwide Building Society said. House prices declined 1.8% m/m after January’s 1.3% m/m decrease.
Nationwide HPI
Asia-Pacific
* The Conference Board Australian leading economic index declined 0.9% in December, the fourth consecutive decline, following revised decreases of 1.1% in November and 0.3% in October, the Conference Board reported. The coincident economic index increased 0.7% in December mainly due to a large gain in retail sales spurred by the government’s economic stimulus package
* Australia’s capital expenditure unexpectedly rose a seasonally adjusted 6.0% q/q in Q4 2008 driven by spending on buildings and structures, following Q3’s upwardly revised 1.6% q/q increase, the Australian Bureau of Statistics reported. Spending on buildings and structures rose 11.5% q/q in Q4, the largest increase in almost two years. Capital expenditure jumped 17.8% y/y. The positive Australian business investment figures suggest Australia’s economic slowdown will not be as deep or as long as other OECD economies.
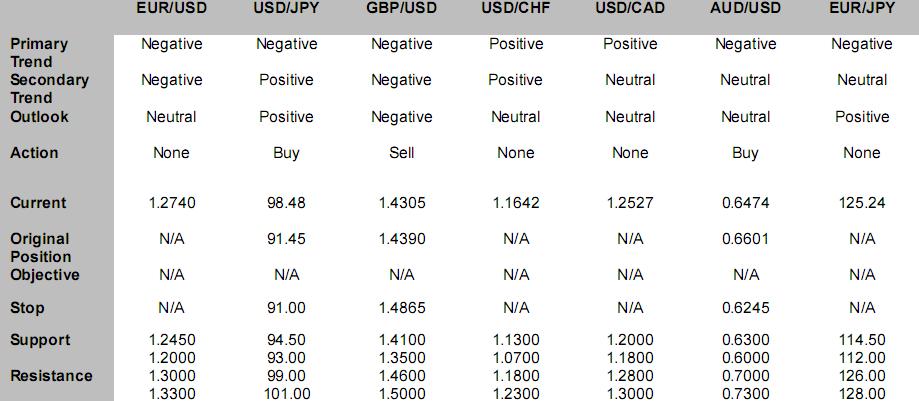
FX Strategy Update
©2004-2008 Globicus International, Inc. and Capital Market Services, L.L.C.
Источник: Hans Nilsson
26.02.2009
 Динамика валютных курсов