EUR/USD downtrend in depth
Euro strength continued this week as technically signaled by the weekly bullish engulfing candle on Friday’s 1.3385 close. The single currency hit highs against the dollar around 1.3539, triggering stops from the original strategy. Price action, however, has been muddy as too can be stated of the drivers behind this recent bout of euro strength. EUR/USD’s rally has been mostly attributed to hawkish ECB rhetoric regarding rising short term inflation risks and its implications of potential ECB tightening. Trichet did note potential short term risks to inflation. However, Trichet also highlighted expectations for medium term inflation to moderate below 2% by year-end but traders at the moment remain focused on rate expectations rather than rate realities. The reality of the Eurozone situation is an ECB that’s in no position to scale back accommodative measures considering the structural problems surrounding peripheral economies, let alone hike rates. Additionally, much of the rise in recent headline inflation is due largely in part to energy price gains suggesting the parabolic ascent in EUR/USD may be overextended.
The Technical Picture: Key 100-day SMA?
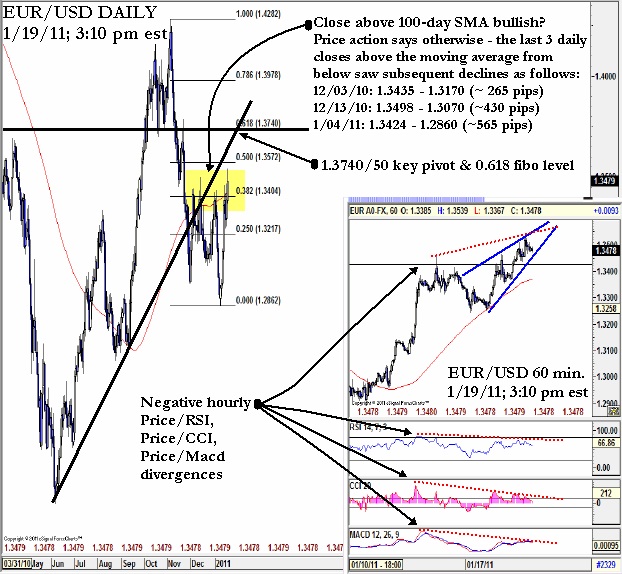
Much has been said of the significance of the 100-day SMA (currently around 1.3425) as it has been a good directional indicator on daily price closes above or below it in the past year. However, closer introspection into recent price action, specifically the last 3 daily closes from below to above the key moving average suggest otherwise. Each of the prior three daily closes above the 100-day SMA from below have actually seen downside reversals in subsequent days. Furthermore, the extent of the reversals lower have been intensifying – the Dec. 3rd daily close saw a subsequent decline of about -265 pips, Dec. 13th saw about -430 pips, and Jan. 4th saw near -565 pips to the downside. Furthermore, hourly charts depict a rising wedge formation (support break has downside implications) and negative price divergence with three separate technical indicators (RSI, CCI, and MACD) as highs in price have not been confirmed by highs in momentum suggesting potential for price to follow momentum lower.
Worth a Thought…again.
EUR/USD may be overvalued at current levels considering the aforementioned fundamental underpinnings and technical developments. Selling EUR/USD on strength for 1/3 of a position around 1.3475 (rising wedge break), another third into the 0.500 fibo level around 1.3575, and the final third around the key 1.3750 resistance (see chart below) for an average rate of 1.3600 may be worth a thought…again. The stop loss would be above the 1.3825 Nov. 11-12 highs around 1.3840 for a total risk of about 240 pips. Take profits would be into the Dec. 8-14 lows around 1.3200 for two thirds of the position and the remaining ahead of the 1.2990 Dec. 1st lows around 1.3000 for a total risk reward ratio slightly better than 2:1.

Источник: FOREX.com
20.01.2011


 Динамика валютных курсов