Silver – Beginning to falter once again?
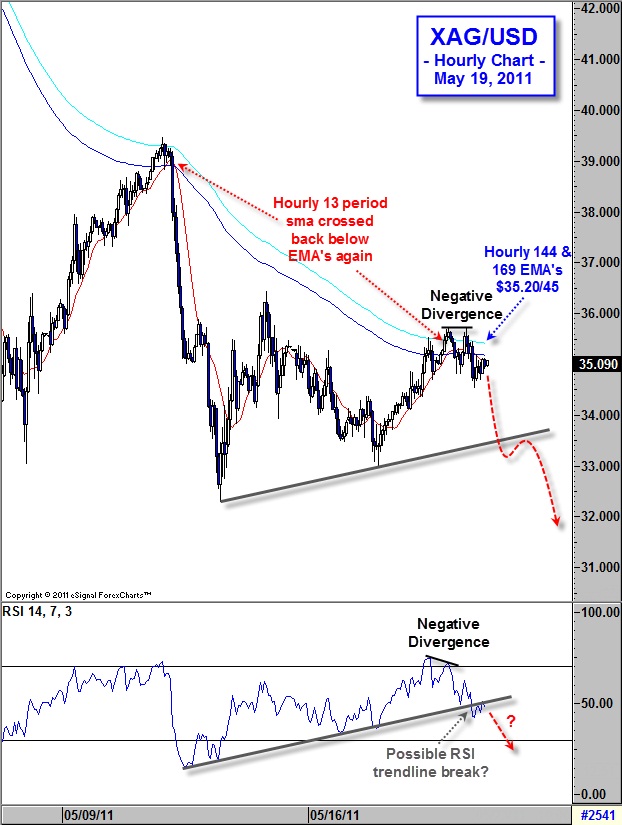
On May 10th I believed we were about to see another sell-off in the ‘poor-man’s-gold’ since it was faced with multiple levels of resistance between $38.80 and $39.50. Sure enough, within the next 12 hours that’s exactly what transpired. Meanwhile, after 48 hours silver broke to a fresh 2-month low, below $33, before putting in a short-term bottom and rebounding back higher. Two weeks ago I debated whether the development was an hourly rising wedge formation or part of a larger overall bear flag pattern – Click here to review. Unfortunately, the debate is still out however I’m currently leaning towards the latter.
Currently Silver sees a similar setup, as the 13-hour sma (red) has once again crossed below the hourly 144 & 169 ema’s (blue). Additionally, there was an RSI negative divergence and this coincided with a short-term double top in price around $35.70/75. Furthermore, it looks like RSI has broken below trendline support (which has been a precursor to moves in the past), however I am reluctant to put too much emphasis on it as it’s still a little bit early to tell.
For those of you who took action based on the idea highlighted on the 10th, it may be prudent to move stops down to breakeven ($39.00) if you haven’t already done so. Alternatively, if you missed the last idea, or are a more aggressive trader you may want to consider establishing a short XAG/USD position, ½ around current levels ($35.05/10) and the other ½ by $35.35/45, with a stop loss above $37.30 and looking for an initial move towards the $32.25/30 prior lows may be an idea worth consideration.

Источник: Forex.com
20.05.2011


 Динамика валютных курсов