Gold – Broke below long-term trendline support…
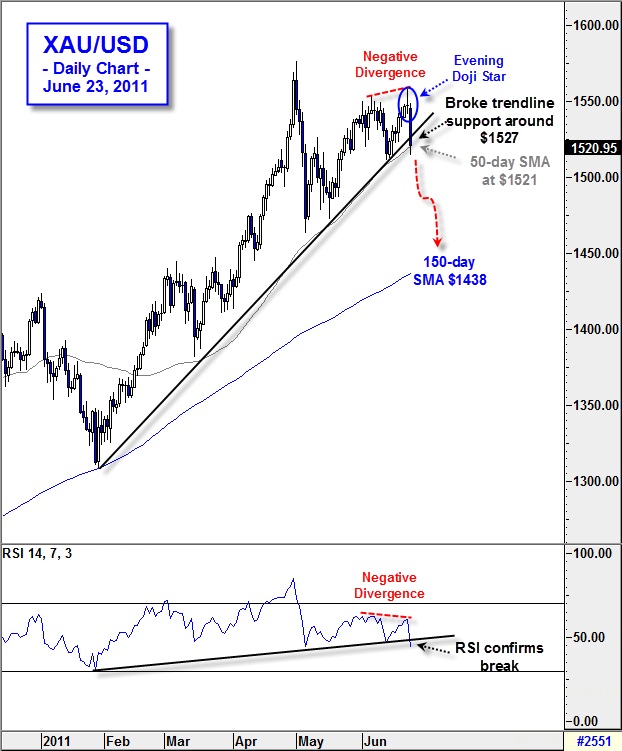
Gold finally broke below long-term trendline support around $1527 earlier today (connect January, March, May & June 2011 lows), which is something I’ve been waiting for patiently over the past few weeks. The sharp decline was sparked by Ben Bernanke’s FOMC testimony yesterday whereby he stated the U.S. economy is recovering at a “moderate pace, though somewhat more slowly” and then was further reinforced earlier today when the International Energy Agency (IEA) announced they would release 2 million barrels of oil from the strategic petroleum reserve (SPR) a day for the next 30 days (60 million in total) beginning next week. Together, the slowdown in the economy and lower oil prices, have eased inflationary fears – Hence, the classically viewed ‘hedges against inflation’ saw swift declines. If I am correct, this is merely the beginning to a potentially severe decline in precious metals over the ensuing weeks.

From a technical perspective, the past three trading days saw gold make an Evening Doji Star formation which is one of the strongest bearish reversal signals in the market – This formation is characterized by the continuation of a bullish trend, which is then followed by a Doji (reflecting uncertainty in the market) and then the trend reversal is confirmed with a sell-off. Typically, the larger a move down is on day-three, the stronger the reversal signal. Furthermore, coinciding this bearish candlestick formation was a Negative Divergence between gold and RSI on the daily chart, whereby gold made a higher high and RSI made a lower high. Today’s decline also saw the precious metal temporarily trade below the 50-day SMA around $1521 – A level we have not been below since mid-February, and a daily close below could lead others to take action. Additionally, we received confirmation of the aforementioned long-term trendline break upon the daily close as well as when RSI broke below its corresponding trendline support level.
With that all said, in my opinion a further decline in Gold is likely to result. Therefore, I believe establishing ½ our XAU/USD short position near current levels ($1521) and the other ½ upon a retest of broken trendline support around $1525-30, with a stop loss above the prior highs near $1558 and looking for an initial move towards the May lows by $1465 while ultimately pursuing a decline towards the 150-day sma, currently around $1438, may be an idea worth consideration.
Источник: Forex.com
24.06.2011


 Динамика валютных курсов