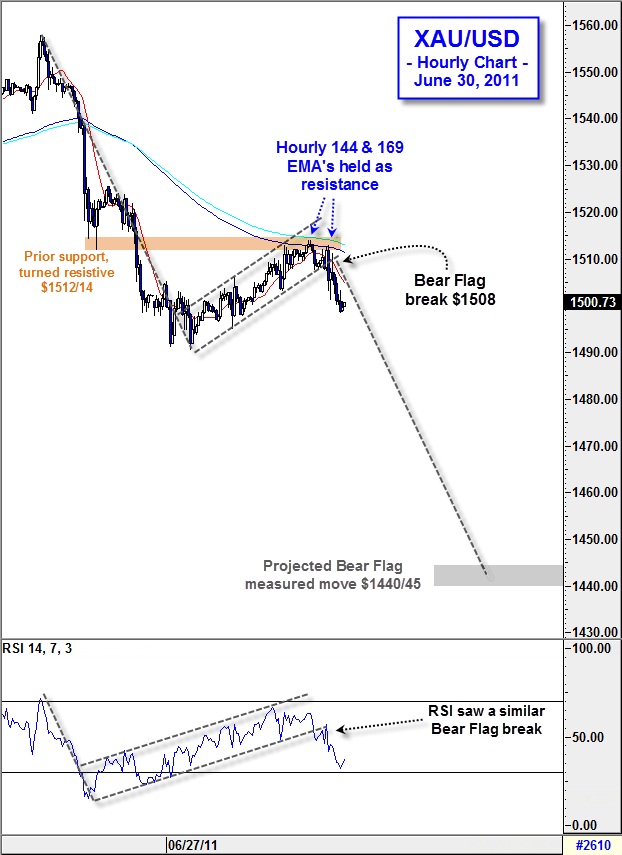
Gold – Last week, trendline break…This week, bear flag break
Last week I highlighted a myriad of bearish technical signs in Gold: Evening Doji Star, Negative Divergence and the break below the 50-day SMA, however the most significant signal was the break below long-term trendline support which had been in place since the beginning of 2011. Faced with such a bearish technical landscape, I proposed selling XAU/USD in last week’s commodities corner – Click here to review. Currently, the gold short (from $1520-25) is doing well, however as I noted last Thursday “this is merely the beginning to a potentially severe decline in precious metals over the ensuing weeks”.
The relief rally gold witnessed over the past 3 days ultimately was short-lived as last week’s lows, as well as the hourly 144 and 169 EMA’s, proved too difficult to surmount. After today’s Bear Flag break it now appears gold is set to continue its multi-week descent (see chart below) and the fact that hourly RSI has seen a corresponding break lower further solidifies this view. If gold breaks below this week’s lows near $1490 it could see losses accelerate towards the May lows around $1465 (initial target) and may then continue to decline to the bear flag’s measured move objective ($1440-45). Interestingly, our ultimate goal for this trade all along has been the 150-day SMA (currently located near $1442), which coincides perfectly with the aforementioned bear flag target.

Source: Forex.com
01.07.2011


 Currency Charts